ABSTRACT
Ambon City, located on Ambon Island, is the capital of Maluku Province. Despite being a small island with steep topography, it attracts a large population due to its status as a provincial capital, resulting in a very high population density per square km. However, with only 17% flat land available for housing and other facilities, hilly areas in the upper land have been cleared, resulting in environmental degradation in the lower area, particularly in Ambon Bay. This chapter aims to discuss the impact of upper-land clearing (ULC) on environmental damage in Ambon Bay. To assess the extent of cleared land (Bared-soil/BS) and loss of dense green vegetation (DGV) in the upper-land faced Ambon Bay, a simple NDVI algorithm was derived from multi-temporal and multi-sensor Landsat satellite imageries between 1972 and 2020. The analysis revealed two periods of ULC: the first was from 1972-1988, and the second was from 2001-2020. ULC is correlated with the total number of inhabitants on Ambon Island. The severe sedimentation caused by ULC has deteriorated the ecosystem in Ambon Bay resulting in unhealthy, stressed, and loss of mangrove vegetation and the decrease of seagrass areas and their species diversity. Coral reef conditions have also degraded, indicated by a decline in the percentage of live coral cover, and the essential fishing ground of live bait fish in Ambon Bay, which once supported the pole and line fisheries in Maluku Province. Addressing the environmental damage on Ambon Bay Island seems challenging. However, it must be prioritized and started seriously from the upper land by strictly prohibiting the UPC for housing and agriculture. Management needs to be conducted in BS areas.
Introduction
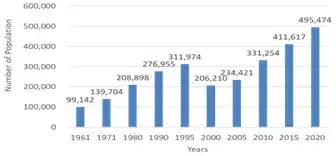
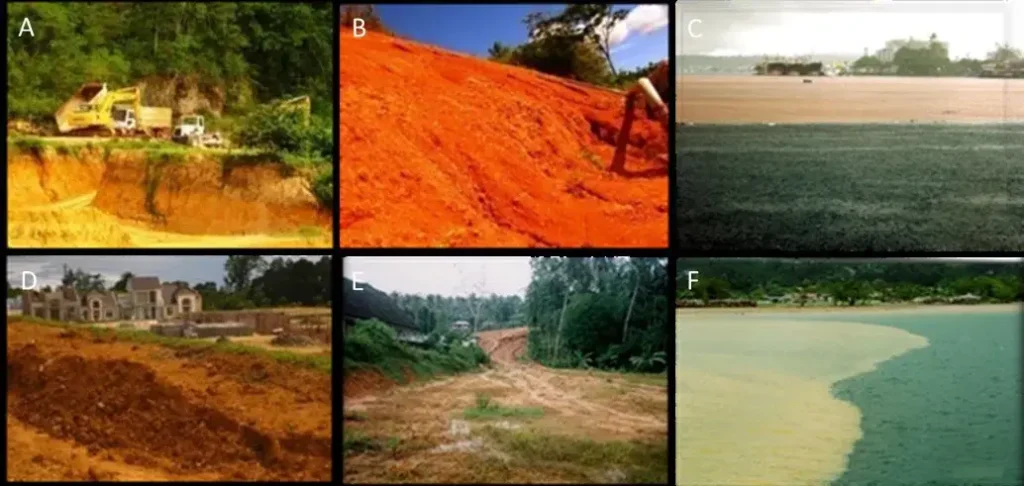
Maluku Province comprises 1,337 islands covering an area of 46,914 km2. One of these islands is Ambon, which serves as the capital of the Maluku province with covers an area of 942.5 km2, which is 2% of the province area. However, only 377 square km or 0.8% of this island is suitable for human habitation and the rest is mountainous. As the capital city, Ambon is the center of government, trade, education, tourism, etc., so it offers a host of attractions that draw people to come and live here not only within Maluku Province but from other provinces as well. As a result, the population of Ambon continues to grow each year (Figure 1). The total population in Maluku Province is 1,848,920 people, with a population density of about 39 people per square km. Meanwhile, Ambon Island’s population in 2020 was 495,474 people, resulting in a high density of 1,314 people per square kilometer. As a result, there is an increasing demand for a more residential area. Unfortunately, Ambon Island is a hilly area with steep slopes from 30 to 45 degrees and a very steep slope greater than 45 degrees. This means that only about 17% of the land area is classified as flat or with a slope of less than 30 degrees, which is suitable for habitation (Kesaulya 2016). The most notable thing in Figure 1 is the population decline of Ambon in 2000 due to social unrest in Ambon City and surrounding areas. Approximately one-third of Ambon City’s population left, causing the population to drop, from 311,974 people to 206,210, which is a 33.9% decrease. However, residents soon returned to Ambon, thus, the population increased to 234,421 people (an increase of 13.7%) in 2005. Over time, the population increased to 495,474 people (140.3%) in 2020. Many land-clearing activities have been carried out in the hilly upper land area to meet the increasing demand for housing in Ambon City. However, these activities have led to heavy sedimentation, especially during the rainy season as shown in Figure 2. The sediments are then washed down to the lower land areas, including Ambon Bay, causing significant environmental damage. The degradation of marine ecosystems in Ambon Bay, which includes coral reefs, seagrass beds, and mangroves, is a direct result of heavy sedimentation. This paper aims to discuss the impact of upper-land clearing (ULC) on environmental damage in Ambon Bay.
Upper-land clearing (ULC) monitoring of Ambon Island
To monitor changes in ULC in Ambon Island, effectively and efficiently we used multi-temporal and multi-sensor data from Landsat satellite. We used different sensors, including a Multi-Spectral Scanner (MSS) on Landsat-1, -2, and -3, a Thematic Mapper (TM) on Landsat-5, and an Enhanced Thematic Mapper Plus (ETM+) on the Landsat-7, as well as the Operational Land Imager (OLI) on Landsat-8. We acquired all the Landsat satellite data used from either the USGS Global Visualization Viewer (GloVis) web, https://glovis.usgs.gov/app? or the USGS Earth Explorer web of https://earthexplorer.usgs.gov/. In this study, we use multi-sensor and multi-temporal data from Landsat satellite images to monitor the extent of dense green vegetation (DGV) and the open land areas or bared soil (BR), as well as their dynamics. To achieve this, we applied a simple Normalized Difference Vegetation Index (NDVI). This algorithm calculates the NDVI values using the formula: NDVI = (Near Infrared (NIR) – Red)/(NIR + Red) Bands. In Landsat-1, -2 and -3 MSS, NDVI=(Band 5-Band 6)/ (Band 5+Band 6). In Landsat-5 TM and -7 ETM+, NDVI=(Band 4-Band 3)/(Band 4+Band 3), while for Landsat-8 and -9 OLI, NDVI=(Band 5-Band 4)/(Band 5 +Band 4) (https://www.usgs.gov/landsat-missions/landsat-normalized-difference-vegetation-index). The NDVI value ranges between -1 and 1. Based on our experience, we have classified NDVI values as follows: NDVI: ≤ 0, non-vegetation (water body, building/roof, road/asphalts, bared soil); NDVI: 0~0.15, Land covered with sparse vegetation; NDVI: 0.15~0.30. Land covered with moderate vegetation; NDVI: 0.30~0.45, Land covered with dense vegetation; NDVI: > 0.45, Land covered with very dense vegetation. Figure 3 depicts the long-term monitoring of ULC activity over 48 years, from 1972 to 2020 along a two km stretch of the coastline using the NDVI formula. This figure indicates that Ambon Island was entirely covered by dense green vegetation (DGV, light, and dark green color) in 1972, and bared soil (BR) areas (pink color) were tiny but steadily increased until 1998, as shown by the decrease of DGV. The BR areas were only located around the city of Ambon. The BR areas in 2001 dramatically decreased to the initial condition in 1972, due to no development activities in Ambon, as a social conflict occurred from 1999 to 2002, which caused the exodus of thousands of people from Ambon City (Figure 1). DGV recovered, and this condition continued up to 2009, with slight increases in BR areas. However, from 2012 to 2020, the BR increased dramatically, and DGV decreased widely, not only around the city of Ambon but along the coastline of Ambon Bay including the Leitimor and Leihitu Peninsulas. Therefore. there are two main periods of ULC on Ambon Island. The first was from 1972 to 1998, and the second from 2001 to 2020 (Figure 4).
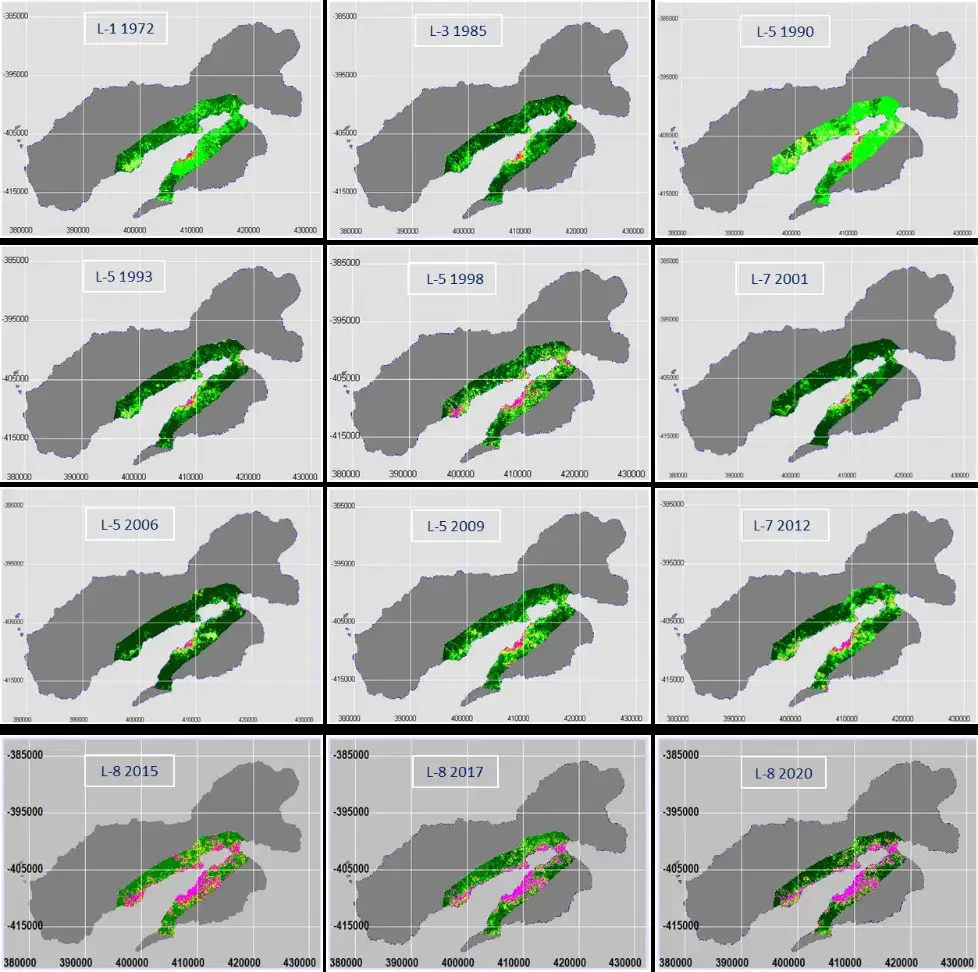
Figure 19.4 provides a detailed description of the two periods of the ULC. During the first period (1972-1998), the BR in 1972 was only 31 ha, while the DGV (dense green vegetation) was 12,389 ha. The BR at the end of the first period in 1998 increased to 714 ha, while the DGV decreased to 10,120 ha. In 1998, ULC appeared around the city of Ambon and Patimura Airport (Laha), which is related to the renovation and extension of the airport runway (Figure 3). The rates of the increase in BR and the decrease in DGV were 24.4 and 81.1 ha per year, respectively. During the second period (2001 and 2020), the ULC of BR in 2001 in Ambon returned to 25 ha, as the condition of the area in 1972 was even slightly lower. However, the BR at the end of the second period of 2020 increased to 2983 ha, while the DGV decreased to 8701 ha. The rates of the increase in BR and the decrease in DGV were 152.9 ha per year and 210.1 ha per year, respectively. This means that the rate of change in ULC due to the increase in BR and decrease in DGV in the second period was 8.3 and 2.6 times higher than in the first period, respectively. This indicated that the development of ULC in Ambon Island as shown in Figures 19.3 and 19.4 is correlated with the increase in Ambon City’s population from 1960 to 1995 followed by the period of social conflict from 2000 to 2002 and the period between 2005 and 2020 when the population doubled from 234,421 to 411,617 people as displayed in Figure 1.

3. Environmental degradation at the lower-land (Ambon Bay)
The ULC was observed on a steep slopes of Ambon Island (Kesaulya et al. 2016) and it was worsened by the high rainfall during the rainy season. From November to June, the monthly rainy days range from 11 to 27, with an average of 19.3 days from 2004 to 2018. During this period, the average monthly rainfall ranged from 74 to 655 millimeters (mm) per month, with an average of 301.2 mm per month (Puturuhu et al. 2020; Sinay et al. 2020). This caused heavy sedimentation, which was deposited in the lower land along the coastline of Ambon Bay. Ambon Bay is comprised of two bays: the Inner Ambon Bay (IAB) and the Outer Ambon Bay (OAB). Due to the less steep topography around IAB, sedimentation is more easily monitored in this area than in OAB (Fig. 5). Mangrove (Fig. 15A) and sedimentation can be seen along the coastline of AIB (white color, Figs. 5B and 5C). Using Landsat-5 TM imagery in 1994 (Fig 5B) and 2007 (Fig 5C) the sedimentation monitored was 102.6 and 168.1 ha, respectively. Thus, the sedimentation rate was 5.04 ha per year (Pelasula, 2008). Locations 1 (Waiheru), 2 (Nania), and 3 (Negri Lama) in Figure 5 are not so concerned by ULC, because the area is relatively flat, or not so steep. At Negri Lama (location 3) there is a small sand mining operation that is mainly used for construction purposes. (in Indonesian, the sand mining type is categorized as Galian C). This sand was sometimes swept away by rain and deposited on the beach through several small rivers or creeks, except in location 4 (Paso). Unfortunately, there is no other newer sedimentation map produced using Landsat data. However, the sedimentation areas in IAB are expected to increase due to the intensification of ULC activities from 2015 until now (Fig. 4). As a result, heavy sedimentation will deteriorate the environment in this bay, such as coral reef, seagrass, and mangrove ecosystems as explained in the subsection below.

3.1 Deterioration of Mangroves in Ambon Bay
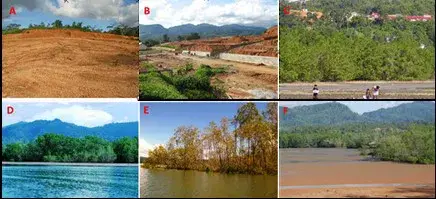
Mangrove forests are a crucial ecosystem that provides various benefits, goods, and environmental services to communities around the IAB. The mangroves offer multiple functions and main benefits, such as protecting both the sea and mainland (Kathiresan 2003), reducing marine ecosystem damage caused by sedimentation and pollution from the land (Othman 1994), and acting as a barrier against abrasion, and seawater intrusion, strong winds, raging storms, and reducing tsunami waves (Onrizal 2003). Additionally, mangroves are home to various wildlife species, such as mollusks, echinoderms, fish, crustaceans, birds, plants, epiphytes, and other biotas. Several marine species use mangroves as spawning grounds, nurseries, and feeding grounds, making them a valuable ecosystem (van Bijsterveldt et al. 2021). The highest economic value of the mangrove ecosystem is coastal fisheries. Therefore, it’s crucial to manage the mangrove ecosystems wisely to ensure their sustainability and functions. Pramudji’s (1987) research shows that the morphology of the Ambon Bay coast, especially IAB, is conducive to the growth and development of mangroves. This is because the area has small rivers and tidal streams with a topsoil layer consisting mainly of mud and sandy soil. Moreover, the IAB is a closed bay that can protect the mangroves from strong winds and big waves. Hence, until the end of the 1980s, the condition of mangroves was still able to adapt to mud and sandy soil. During this time, the ULC, which is indicated by bared soil (BR) areas, was not widespread. It only covered 125 ha for the entire Ambon Island (Fig. 4). However, in 1998, at the end of the first period of ULC, the BR increased significantly to 714 ha, which is 5.7 times higher than in 1990. This expansion made the sedimentation areas around the IAB wider (Fig 5c). There are at least 20 species of true mangrove recorded in Ambon Bay (See Chapter 12, Suyadi et al. 2023), despite it being a relatively small size area. However, these mangroves are only found in eight locations in IAB and one in Tawiri, OAB (Fig 5a). A survey of mangrove transects in 2008 showed that only eight of 20 species representing five families were at these locations (Table 1) The data also revealed that the location in Paso had the highest tree density of 580 stems per ha, but the lowest sapling density of 800 stems per ha, with the dominant species Sonneratia alba, and the co-dominant species Rhyzophora apliculata. The lowest tree density was in Nania (350 stems per ha) but had the highest sapling density of 2800 stems per ha (Suyadi 2009, 2012). The mangroves in IAB were still in good condition until the end of the 1980s (Pramudji 1987). However, since 1994, there has been increased sedimentation along the IAB coast (Figure 19.3, 19.4), resulting in severe stress on the mangrove. This has led to a decrease in their area. According to an analysis of old Landsat MSS satellite images conducted by the Indonesian Institute of Sciences (LIPI) in 1998 (unpublished), the mangrove area had decreased by 21% between 1986 and 1999 due to conversion into residential areas, national housing estates, and other uses (Sapulete et al. 2007; Suyadi 2012). The decrease in mangrove area was further exacerbated by erosion and sedimentation, which was particularly heavy in locations 1 (Waiheru), 2 (Nania), 3 (Negri Lama), and 4 (Paso) (Nontji, 1996, (Fig 5b and 5c). Unfortunately, the spatial development in Ambon City the city of Ambon is not well organized, posing a threat to the sustainability of the coastal ecosystem of Ambon Bay (Sihaloho 1996).
Table 1: List of mangrove species; Density (stem ha-1) of tree, sapling, and seedling; IVI (%) in IAB (Waiheru, Nania, Negri Lama, and Paso) and in OAB (Tawiri) (Source: Pelasula 2008; Suyadi 2009, 2012, 2021).
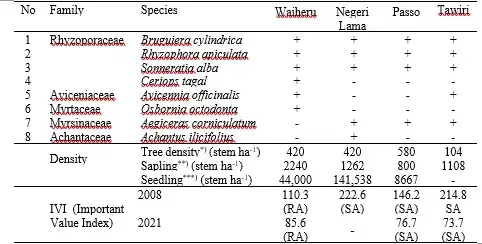
Remarks: *) Tree is when the trunk circumference > 10 cm at breast height; **) Sapling is when the trunk circumference ≥ 2 – 10 cm at breast height; ***) Seedling is when the trunk circumference < 2 cm at breast height, RA: Rhizophora apiculata; SA: Sonneratia alba, IVI = RDen(%) + RF(%) + RDom(%); Maximum value of IVI=300 % (see Cox, 1967). RDen (Relative Density) = Density of species mangrove found in a transect / Density of all species RF (Relative Frequency) = Frequency of species mangrove found in a transect / Frequency of all species, RDom (Relative Dominance) = Dominance of species mangrove found in a transect /Dominance of all species.
According to a recent study, the latest mangrove vegetation has been steadily decreasing over the past two decades. The study used two Landsat-5 TM and one Landsat-8 OLI image and found that the area covered by mangroves has gone from 63 ha in 1999 to 62 ha in 2009 and 58 ha in 2019, which is a loss of 9%. The average mangrove decline rate was observed to be 0.5% per year (Suyadi et al. 2021). The study also revealed that the mangrove importance value index (IVI) decreased, with IVI Rhizophora apiculata (RA) in Nania dropping from 79.4% to 59.9%, and the IVI Soneratia alba (SA) in Paso decreasing from 146.2% to 76.7%. Similarly, the IVI RA in Waiheru decreased from 110.3% to 85.6% (Table 19.1, Pelasula 2008; Suyadi 2009; Suyadi et al. 2021). These findings suggested that the decrease in mangrove areas is likely due to sedimentation along the IAB coastline.
The mangrove area in Paso (IAB) on Ambon Island is the largest, with Rhizophora apiculata and Sonneratia alba being the dominant species (Table 19.1). These species are known for their ability to function as sediment traps, trapping up to 30% of sediments (Khatiresan 2003). However, the rapid sedimentation rate in IAB has been increasing rapidly, reaching 5.04 ha/year between 1994 and 2007 (Fig. 5), which is equivalent to the rate of clearing land (BR) at 115.8 ha/year between 1993 and 1998 (peak ULC of the first period). The rate of clearing land has increased significantly from 2006 to 2020 (peak ULC of the second period), reaching 203.8 ha/year, which is 1.8 times higher (Fig. 4) than the previous rate. This increase in sedimentation rate has caused the mangroves to lose their ability to trap sediment, putting them under severe stress. This stress eventually led to restriction in their growth (Hamid et al. 2000), loss of physical strength (Fig 6), or even death if excess sedimentation buries the mangrove’s roots (Ellison 1999).
Field measurements conducted in the Mekong Delta of Vietnam have shown that mangroves die when their roots are buried in sediment deeper than 1.2 m while surviving trees have a typical root that goes no deeper than 0.6 m. However, planting saplings with roots buried no deeper than 0.2 m can help restore dead mangrove areas to become green again (Nardin et al. 2021). Meanwhile, a study conducted by Halim et al (2021) in Rembang Regency found that the density of mangroves was higher in areas where sedimentation rates were lower.
Furthermore, the mangrove community in Paso has the lowest number of saplings (800 stems) and seedlings (8,667 stems) compared to other locations in IAB (Table 1; Pelasula 2008; Suyadi 2009). Due to this, it is becoming difficult to regenerate young mangroves at this location. The back side of the mangrove in Paso has also been converted into various types of development. Thus, it seems that mangroves in the entire Ambon Bay will be very difficult to recover due to sedimentation and exacerbation by plastic wastes, which come from the sea and land, dumped away by the community around the mangrove areas (Fig. 7) in the form of microplastic (247 pieces/m2), mesoplastic (103 piece/m2) and macroplastic (81 pieces/m2) (Suyadi et al. 2021). Plastic wastes were the highest in Paso, followed by Waiheru and Nania, with a total amount of 276, 214, and 76 pieces of plastic/m2, respectively (Suyadi et al. 2021). During the early 1980s, the mangroves in Paso were in excellent condition, thanks to the hard work and dedication of Mr. Dominggus Ledrick Sinanu. His effort to take care of the area earned him the prestigious Kapaltaru environmental award from the Indonesian Minister of the Environment, Prof. Dr. Emil Salim in 1981. However, the mangroves in the IAB area have degraded significantly nowadays (Pramudji and Pulumahuny 1998; Suyadi 2009; Suyadi et al. 2021) and some best spots such as in Passo may vanish entirely in years to come.
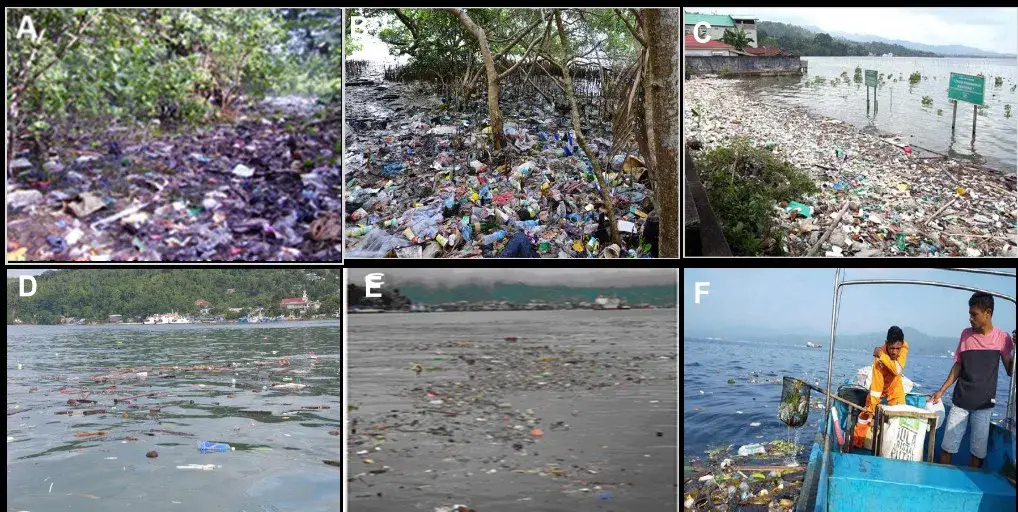
Plastic waste is now a worldwide concern and threatens the world’s largest single mangrove forest in the Sundarbans between Bangladesh and India, which is a UNESCO World Marine Heritage (Adyel and Macreadie 2021). Paler et al. (2022) also found plastic wastes in the landward, middle, and seaward areas of mangroves in Cebu, the Philippines. Suyadi and Manulang (2020) have discussed the implications of plastic waste deposits in mangrove areas on small Island in Indonesia, and similar findings have been reported in Ambon Bay as well (Suyadi et al. 2021; Suyadi et al. 2023, Chapter 12). Fig 19.7 shows that plastic waste is the dominant type of garbage deposited on land around mangroves in the IAB. An experiment was conducted at Demak’s beach, which is located on the northern coast of Java, to study the impact of plastic waste on mangroves. The study revealed that 50% of the mangrove area was covered by plastic, with an average density of 27 pieces/m2. The findings suggested that mangroves can withstand partial burial of plastic waste (50%), but if the plastic continues to accumulate (100%), especially near mismanaged plastic sources, it can damage the mangroves (van Bijsterveldt et al. 2021). Therefore, it is crucial to manage waste plastic and take conventional mangrove restoration efforts such as replanting mangroves or rehabilitating the habitat in Ambon Bay.
3.2 Deterioration of seagrass beds in Ambon Bay
Seagrasses are a type of flowering plant, that can grow fully submerged and rooted in estuarine and marine environments (den Hartog 1970). Indonesia is home to extensive seagrass areas that cover about 31,000 km2 (Kuriandewa et al. 2003). The diversity of seagrass species is not so high with only 14 species identified. These are Halophila spinulosa (HS), H. decipiens (HD), H. minor (HM), H. ovalis (HO), Enhalus acoroides (EA), Thalassia hemprichii (TH), Cymodocea serrulata (CS), C. rotundata (CR), Halodule pinifolia (HP), H. uninervis (HU), Syringodium isoetifolium (SI) and Thalassodendron ciliatum (TC) were found (den Hartog 1970). Two other species, Halophila beccarii and Ruppia maritima, were previously found in Indonesian waters but have not been discovered recently, but the specimens are stored in Bogor Herbarium, Research Center for Biology-LIPI (Kuriandewa et al. 2003). In 2007, a new species of Halophila sulawesii was found in the Spermonde Islands, South Sulawesi by Kuo (2007). Seagrass ecosystems play an essential role in the coastal processes including (1) providing shelter, spawning, nursery, and foraging places for various faunas such as fish and other animals, (2) enriching primary production in coastal waters, (3) capturing and recycling nutrients, and (4) acting as a sediment trap and shoreline stabilizers (Susetiono 2004).
It is reported that there are only seven species of seagrasses in Ambon Bay, in which Six species are found in IAB. These species are Halodule pinifolia (HP), Cymodocea rotundata (CR), Enhalus acoroides (EA), Thalassia hemprichii (TH), Halophila ovalis (HO), and Halophila minor (HM) belonging two families. (Pelasula, 2008; Irawan and Nganro 2016; Rugebregt et al. 2020; see Table 19.2). However, according to Irawan (2011) and Irawan et al. (2023/Chapter 10), one species, Halodule uninervis (HU), which was never recorded in IAB, was found only in OAB at Hative Besar with its patchy growth. In contrast, Rumpeniak et al. (2020) in their inventory study of seagrass associated with gastropods claimed that HU was also found in IAB at the coast of Poka Village. For a comprehensive account of all seagrass species recorded in IAB dan OAB, readers can see them in Irawan et al. (2023) in Chapter 10 of this book.
Six out of seven species of seagrasses were discovered in Tanjung Tiram (Poka), and Halong. However, Lateri, Paso, and Waiheru had only two and one species of seagrasses, respectively. Three species of seagrasses were found In OAB (Galala and Wainitu), which were just a few hundred meters away from IAB, while Tantui had only one species (Pelasula, 2008). EA was present at almost all sites in IAB and OAB with a frequency of presence (FP) of 87.5%. TH and HO had a presence in 50.0% of the sites, while other species were present in less than 50% of the sites (Table 2). In terms of density, Tanjung Tiram has the highest total density of seagrass, with 1,153 shoots/m2. This is followed by Wainitu with 858 shoot/m2) and Halong with 497 shoot/m2, other sites < 400 shoot/m2. The substrates in Tanjung Tiram were mud, muddy sand, and coral rubble, while the substrates in other locations were generally almost the same as in Tanjung Tiram (Pelasula 2008). Table 2 species composition and density (shoot/m2) of seagrass in IAB (1-5) and OAB (6-8) (Source: Pelasula, 2008).
Table 2 species composition and density (shoot/m2) of seagrass in IAB (1-5) and OAB (6-8) (Source: Pelasula, 2008).

Remarks: (1) Tanjung Tiram, (2) Halong, (3) Lateri, (4) Waiheru, (5) Passo, (6) Galala, (7) Tantui, (8) Wainitu. (- absent), Fr: Frequency of presence (%); Another species of Halodule uninervis (HU) was found patchy in OAB with the exact site in Hative Besar (Irawan et al. 2023 in Chapter 10).
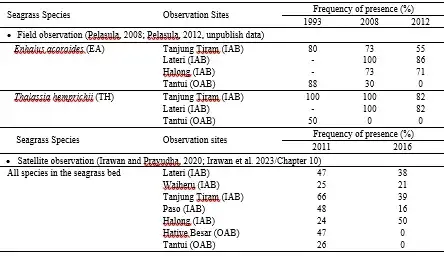
Table 3 displays the results of a long-term monitoring program that was conducted in 1993, 2008, and 2012 to observe the frequency of presence (FP) of seagrass in some sites of IAB dan OAB (Pelasula, 2008; Pelasula 2012, unpublish data). This table reveals that three of the four seagrass observation sites in IAB (Halong, Lateri, Tanjung Tiram) and one in OAB (Tantui) showed a decreasing trend in FP of seagrass from 1993 to 2008 and 2012 (Pelasula 2008; Pelasula unpublished data). This decline in seagrass FP was even observed in seagrass species that have a large morphology with strong rhizome roots and broad leaves and are highly adaptable to environmental changes, such as Enhalus acoroides, EA, and Thalassia hemprichii, TH species (Figure 8). These two species were no longer found at Tantui in 2012 (Table 19.3).
Table 3 displays the results of a long-term monitoring program that was conducted in 1993, 2008, and 2012 to observe the frequency of presence (FP) of seagrass in some sites of IAB dan OAB (Pelasula, 2008; Pelasula 2012, unpublish data). This table reveals that three of the four seagrass observation sites in IAB (Halong, Lateri, Tanjung Tiram) and one in OAB (Tantui) showed a decreasing trend in FP of seagrass from 1993 to 2008 and 2012 (Pelasula 2008; Pelasula unpublished data). This decline in seagrass FP was even observed in seagrass species that have a large morphology with strong rhizome roots and broad leaves and are highly adaptable to environmental changes, such as Enhalus acoroides, EA, and Thalassia hemprichii, TH species (Figure 8). These two species were no longer found at Tantui in 2012 (Table 19.3).
Table.3. The changes in seagrass over the years in IAB and OAB are based on field observation (upper part of the table) and Satellite observation (lower part of the table).
Irawan and Prayudha (2020) conducted a study on the changes in the seagrass canopy in seven permanent transects in Ambon Bay over five years. They used multi-temporal Google Earth satellite images from 2011 and 2016. Another study conducted by Irawan and Prayudha (2020) monitored the changes in seagrass canopy cover in seven seagrass meadow permanent transects in Ambon Bay, showed a decreasing trend of canopy cover in all observation sites, except for one in Halong (IAB) (Table 3). Of the seven permanent transect sites, two in Lateri and Waiheru slightly decreased from 47.1% (2011) to 38.0% (-9.1%) and from 25.0% to 20.9% (-4.1%), respectively. The two sites of Tanjung Tiram and Paso sharply decreased from 65.7% to 39.3% (-26.4%) and from 48.3% to 16.3% (-32%), respectively. The worst of the remaining sites were Hative Besar and Tantui, which extremely lost seagrass canopy cover from 47.3% to 0% (- 47.3%) and 26.2% to 0% (- 26.2%). Only in Halong, the seagrass canopy cover increased from 24.3% to 50.0% (+25.7%) (see Fig. 10.3 of Irawan et al. 2023/ Chapter 10).
A study conducted on the population dynamics of a certain seagrass species in Tanjung Tiram (IAB) showed that TH is in decline (Tupan et al. 2016). The primary reason for the depletion of these seagrass species is the heavy physical pressure on the seagrass and its habitat, triggered by severe sedimentation and solid waste (Kuriandewa 1999; Pelasula 2008, Suyadi et al. 2021; Irawan et al. 2023/Chapter 10). Meanwhile, species such as EA and TH are capable of adapting to sedimentation, if the sediment rate is too high as shown in Figure 19.8, these species will eventually get buried by the sediment deposit in the seagrass bed. On the other hand, all small-sized seagrasses such as HO, HM, and HP, lose their species, and they get buried in sediments (Kuriandewa 1998). Consequently, all seagrass species in Ambon Bay are in an unfavorable condition (Pelasula 2008; Tuhumury 2008; Irawan and Nganro 2016; Tupan et al. 2016), similar to the mangrove ecosystems (Pramudji and Pulumahun 1998; Suyadi, 2009; Suyadi et al. 2021).

3.3 Deterioration of Coral Reefs in Ambon Bay
Coral reefs are a crucial ecosystem, especially for maritime countries, as they provide value for ecology, economy, and sociology in various sectors (Ogden 1988). Although covering only 0.1% of the planet’s surface, coral reefs are the most productive ecosystems in the world, offering habitat for over a million species of marine life, as well as essential ecosystem services such as food, medicine, beach protection, marine tourism, and natural laboratory for hundreds of millions of people in the tropics and subtropics. Coral reefs contribute 10 % of the world’s fishery products like shellfish and other invertebrates (Kenchington and Hudson 1988; Pelasula et al. 2021).
Coral reef plays a crucial role in the ecosystem, but it’s rapidly deteriorating due to various factors such as deforestation, intensive agriculture, coastal development, and urbanization. These activities lead to an increase in pollutants in coastal waters, such as nutrients and sediment loads (Ramos-Scharrón et al. 2015). In addition, human activities such as overfishing methods, destructive fishing methods, uncontrolled tourism, coral diseases, and global climate change, which causes a rise in sea temperature are contributing to coral bleaching and the degradation of coral reefs (Hughes et al. 2003). If these factors continue to increase, coral reefs’ abundance in biodiversity and ecosystem services will decline (Cinner et al. 2012; Pendleton et al. 2016) and their extent will continue to decrease. Currently, coral reefs’ extent is declining by 19%, and 15% of the total area is in a threatened status globally (Díaz-Pérez, et al. 2016; Hedley et al. 2016a). Nine countries including Indonesia, are most vulnerable to coral reef degradation due to their high human dependence on the coral ecosystems (Hughes et al. 2003).
The coral reefs in Indonesia cover an area of about 2.5 million hectares as stated in the unpublished report by P2O-LIPI. Sadly, due to various factors, only a low percentage of Indonesian coral reefs are in good condition, as indicated by observation at 1064 coral reef sites. Out of these, 374 sites (35.2%) have poor conditions with a living coral cover of less than 25%, 373 sites (35.13%) are in medium condition (25 – <50%), 249 sites (23.4 %) are in good condition (50-75%), and only 68 sites (6.4%) are in excellent condition (>75%) (Suharsono 2017; P2O-LIPI unpublished report). In Ambon Island, the fringing reef types are prevalent along the coast of Ambon Bay, particularly in OAB (Sutarna 1987; Pelasula, 2008). The total area of reefs is approximately 101.6 ha, with 18.4 ha in AIB and 83.2 ha in AOB. The Line Intercept Transect (LIT) method that was used to study the coral reef in Ambon Bay showed evidence of a decrease in the percentage of live coral cover in almost all sampling locations (Sutarna 1987; Leatemia 1996, Leatemia and Alik 2008; and Pelasula 2008). The coral reefs in Ambon Bay are in a state of deterioration, mainly due to severe sedimentation caused by ULC activities (Table.4, Fig. 9). This information has been summarized by the Pelasula et al. (2022) study, which includes data from Table 19.4 and Figure 19.9. Long-term monitoring of coral reefs was conducted from 1987 to 2019, covering 32 years. The monitoring revealed that eight observation sites, six in OAB and two in IAB showed a significant decrease in coral cover, especially in IAB and in Hative besar, Batu Capeo, and Poka of OAB. All those sites showed poor condition of coral reefs. Despite the coral cover decreasing in some areas, Liliboi, Eri, and Kota Jawa in OAB are still in good coral condition, although the percent cover in these sites decreased, particularly in Eri, which changed from excellent to good condition. However, there was a slight recovery of live coral percentage in some sites, such as Poka in the early 2000s, which could be due to a significant drop in the population of Ambon from 311,974 in 1995 to 260,210 in 2000 (see Fig 19.1). Additionally, the decrease of bare soil (BS) areas, while dense green vegetation (DGV) was significantly increasing to the same level as in 1972 (see Fig 19.4) may have contributed to the recovery of coral reefs. This fact indicates that the reduced population causes activities on land to decrease, resulting in a reduced negative impact on coastal ecosystems, specifically on the coral reef.
Table 4: Long-term monitoring of live coral cover (%) and their condition in IAB and OAB from 1987 to 2019 (data modified from Pelasula et al. 2022).


Picture credit: Fredy Leatemia (A and B) used with permission; D. Pelasula (C and D). It is not sufficient to evaluate the health of coral reefs solely based on the percentage of coral cover. Two coral reefs with the same percentage of live coral cover may have different levels of damage. Therefore, it is necessary to assess the degree of damage using the coral mortality index. Table 19.5 presents the coral mortality index at different locations in Ambon Bay in 2008. The mortality index values range from zero and one, with a value close to zero indicating no change in live coral, while an index value close to one suggests a change in live coral that results in dead corals, which eventually becomes covered with algae.
Based on this index value, the locations in Hunuth, Batu Capeo, and Hative Besar have a low mortality index value (0 to 0.01), which means that there is no significant change for live coral, since the percentage of live coral cover is also low (9.1- 22.5%), or corals in poor condition (Table 5). Poka, Liliboi, Eri, and Kota Jawa had a low coral mortality index (0.0 to 0.11), but the percentage of live coral cover was relatively high (48.4 to 67.7%), or corals were in fair and good conditions, which also meant that there was no significant change for live coral, but the algae component is relatively high (5.0 to 29.1%), especially in Liliboi (29.1%) followed by Eri (14.2%). These four sites show a competition between coral taxa and various algae species that can lead to coral degradation due to severe sedimentation caused by ULC, which leads to dead corals being replaced by algal components such as turf algae, coralline algae, or macroalgae. In Halong, coral degradation was most evident, with the live coral cover being 35.6% (fair condition), dead coral being 16.7%, and mortality index was 0.3 with the algae component of 27.3%. In 2019, the condition of corals in Poka declined drastically to poor (19.3%) (see Table 4). Table 5: The mortality index of the coral reef ecosystem found in several monitoring sites along Ambon Bay in 2008 (Source: Pelasula 2008).

The decline in the percentage of live coral cover, including in seagrass beds throughout Ambon Bay (IAB and OAB), may influenced by the optical properties of Ambon Bay waters. Sathyendranath and Morel (1983) divided the water properties into two classes. Case-1 waters are the waters where the water column is dominated by: (1) Living phytoplankton cells (Chlorophyll-a/Chl-a), (2) The debris of phytoplankton due to zooplankton predation, and (3) Dissolved organic substances resulting from phytoplankton degradation. Case-1 waters are usually clear waters with high water transparency, including oceanic waters. The optical properties change to case-2 waters if case-1 waters add one or more of the following properties: (4) Re-suspended sediment from the bottom of the sea, (5) Sediment particles from land enter the rivers (runoff) (6). Dissolved organic matter comes from land, and (7) particle or suspended material comes from household waste. Thus, Case-2 waters are generally turbid such as in coastal areas. To determine the Case-1 and Case-2 waters, Topliss et al (1990) classified these water properties using the ratio between the concentration of total sediment material (TSM or Seston) and the total pigmentt of phytoplankton or chlorophyll-a (Chl-a) in the water column. If the ratio of Seston to Chl-a (Seston : Chl-a) is less than 6.6, then the waters are classified as Case-1 water or clear waters that are dominated by phytoplankton. Otherwise, if the ratio is higher than 6.6 and sediments are higher than 10 mg/l, then the water is classified as Case-2 water or turbid waters that are dominated by sediments. Based on Topliss et al (1990) criteria, Wouthuyzen (2001) analyzed the ratio of Seston to Chl-a in Ambon Bay, seven stations in IAB, and seven stations in OAB between March and December 1997. The results showed that in IAB, the ratio ranged from 2.6:1 to 26.0:1, with an average of 17.1:1, while in OAB the ratio ranged from 3.9:1 to 26.7:1 with an average ratio of 19.0:1. The ratios both in IAB and OAB were above the criteria of 6.6:1 of Topliss (1990), indicating that the optical properties in both IAB and OAB belong to Case-2 water or turbid waters, dominated by sediments. Only two stations had a ratio value of less than 6.6:1, one in IAB (2.6:1) and one in OAB (3.9:1). This result suggested that the intensive ULC since the first phase from 1972 to 1998 may have caused coral degradation as shown in Tables 19.4 and 19.5. Loss of important fishing ground of live bait fish in Ambon Bay During the 1970s to 1980s, The IAB of Ambon Bay was very famous as a fishing ground for live bait. Live bait fish are small fishes (7-15 cm) caught using a beach seine, which is called redi in Ambon. These fishes are kept alive for later use as live bait for catching skipjack tuna (Katsuwonus pelamis), the important pole and line fisheries for Maluku Province (Matakupan 1983; Wouthuyzen et al. 1984). The bait fishes were abundant in the IAB from the early 1970s to the end of the 1980s, as well as their high species diversity. Some important bait fish species recorded from IAB that support pole and line fisheries are various species of anchovies, such as Shorthead anchovy, Stolephorus heterolobus (local name: Puri merah]), Indian anchovy,S. indicus (local name: Puri putih], and Black anchovy, S. buccaneri (local name: Puri hitam), Juvenile of various fish, such as sardines (Sardinella spp, local name: Make), mackerel (Rastrelliger sp., local name: Tatare), scad (Decapterus spp., local name: Momar), frigate mackerel (Auxis thazard, local name: Komo), fusilier (Caesio sp. local name: Lolosi), Baelama anchovy, Thrissina baelama (local name: Lompa), Silver-stripe round herring, Spratelloides gracilis (local name: Gosau), and Cape silverside, Atherina sp. (local name: Kalauna) (Matakupan 1983; Wouthuyzen et al. 1984). A year-round survey on live bait fish for supporting pole and line fisheries in IAB was conducted by a Japanese researcher Kawakami (1974) from December 1970 to November 1971. This survey revealed that shorthead anchovy (Stelophorus heterolobus) was predominantly caught (80-100%) by beach seine throughout the year at four fishing grounds locations of Galala, Halong, Lateri, and Rumah Tiga. The second predominant species caught almost throughout the year (50-75%) was Sardinella spp. Other species of Rastrelliger sp., Decapterus spp., and Caesio sp. were caught in only 3-4 months with catch percentages ranging from 1-24%. In 1974-1975, the live bait fish caught tended to decrease to around 33.2%, although shorthead anchovy is still predominantly caught (Sumadhiharga, 1978). In the 1980s, changes in the bait fish composition became more distinct. Stolephorus heterolobus, Auxis thazard, Caesio sp., T. baelama, and Spratelloides sp. were no longer caught easily. Species that were more tolerant and able to adapt to environmental changes tended to increase, such as fish from the family of Clupeidea and Carangidae, like Sardinella spp, Caranx sp. (local name: Bobara), and Selar sp. (local name: Selar). Changes in the composition of live bait fish species indicate environmental changes (Wouthuyzen et al. 1984) due to sedimentation or pollution as suspected by Anderson and Robinson (1982). According to Amesbury (1981), sediment is one type of pollution that affects coral reefs and the biota associated with them, including fish. Sedimentation due to ULC has proven to damage Ambon Bay’s mangrove, seagrass, and coral reef ecosystems. The results of the study on population dynamics of shorthead anchovy in Ambon Bay especially in IAB showed a tendency to over-fish (Wouthuyzen 1984; Ongkers 2006). Environmental damage has also exacerbated the decline in this anchovy species’ population due to the decrease in water quality. This is indicated by the increase in natural mortality (M) (Wouthuyzen et al 1984; Anderson and Robinson 1982). IAB was first known as a spawning and nursery ground for various species of bait fish, particularly anchovies in 1973 after sampling fish eggs taken by ichthyoplankton experts from Japan (Kawakami, 1974) and from UNESCO (Sapulete 1983). Another study on zooplankton conducted by Sutomo (1983) and Huliselan (1983) confirmed these findings. Those studies found the peak of the spawning season of anchovies in IAB was from June to August, which coincides with the peak of the rainy season on Ambon Island and is associated with the influx of large amounts of sedimentation into Ambon Bay (see Figure 19.6). The high sedimentation that continues to increase from year to year will cause the ability of anchovies to be unable to adapt to drastic environmental changes. Thus, their ability to spawn or lay eggs in the IAB also decreases drastically. As a result, the population of Anchovies will continue to decrease and it will be difficult to find in IAB, which cause the loss of live bait fish to support the most important pole and line fisheries in Maluku Province for catching skipjack tuna, such as in periods of the 1970s-1980s era. Other species of bait fish, such as juvenile reef fish, Lolosi, andjuvenile pelagic fish that live in the open seas, such as Tatare, Momar, and Komo avoid IAB due to high sediment concentrations (Wouthuyzen 2001). Therefore, IAB which was previously famous as a live bait fish fishing ground no longer exists and remains only a memor
Conclusions
After long-term monitoring of ULC analysis using multi-temporal and multi-sensor Landsat satellite images and observing the condition of the Ambon Bay ecosystem for nearly five decades, we found that ULC has caused severe sedimentation that damaged the ecosystem in the lower lands (Ambon Bay). The condition of the mangrove, seagrass, and coral reef ecosystems in Ambon Bay is getting worse, so it is worrying that their role may be reduced and not properly functioning. Likewise, the live bait fish resources in IAB that support the important pole and line fisheries in Maluku Province disappeared. Plastic waste also exacerbated the damage to the ecosystem in Ambon Bay. Mitigation of the environmental damages on Ambon Island seems complicated, hard to implement, and challenging. Environmental management in Ambon Island must be prioritized and started seriously from the upper land, e.g. by prohibiting or strictly limiting the clearing of these areas for housing, agriculture, and the need to conduct reforesting. Without good upper-land control, it is impossible to rehabilitate the ecosystems in lower land (Ambon Bay). Meanwhile, all stakeholders and communities in Ambon Bay must participate in all forms of efforts to manage the sustainability of Ambon Bay well. It is hoped that in such a way the ecosystem deterioration of Ambon Bay probably can be recovered.
Author contributions: Conceptualization, SW, AS; methodology, SW, AS, DPP; data curation, DDP, investigation, SW, AS, DDP: writing the original draft preparation, SW: writing-review, SW, AS; All authors have read and agreed to publish. References
Adyel TM, Macreadie PI 2021 World’s Largest Mangrove Forest Becoming Plastic Cesspit. Front. Mar. Sci. 8:766876. doi:10.3389/fmars. 2021.766876.
Amesbury SS 1981 Effects of turbidity on shallow water reef fish assemblages in Truck, Eastern Carolina Island. Proc 4th Int. Coral Reef Symp. 1:155-159.
Anderson JJ Robinson B 1982 Plankton bait fish dynamics in Ambon Bay, Indonesia. Preliminary proposal for cooperative research in marine Science with Indonesia 4 pp.
Cinner JE, Pratchett MS, Graham NAJ, Messmer V, Fuentes MMPB, Ainsworth T, Williamson DH 2016 A framework for understanding climate change impacts on coral reef social-ecological systems. Regional Environmental Change, 16(4), 1133–1146 https://doi. org/10.1007/s10113-015-0832-z.
Cox GW 1967 Laboratory Manual of General Ecology. MWC Brown Company,
Den Hartog C 1970 Seagrass of the World. North-Holland Publishing Company. Amsterdam. London, p 271.
Díaz-Pérez L, Rodríguez-Zaragoza FA, Ortiz M, Cupul-Magaña AL, Carriquiry,JD, Ríos-Jara E, Del Carmen García-Rivas M 2016a. Coral reef health indices versus the biological, ecological, and functional diversity of fish and coral assemblages in the Caribbean Sea. PLoS ONE, 11(8). https://doi.org/10.1371/journal.pone. 0161812. Ellison JC 1999 Impacts of Sediment Burial on Mangroves. Marine Pollution BulletinVolume 37(Issues 8–12):420-426. https://doi.org/10.1016/S0025-326X (98)00122-2
Hamid G, Khan NA, Moshin SI, Meynell PJ 2000. Impact of sedimentological processes on the mangrove ecosystem of the Indus Delta. Pakistan Journal of Marine Science, 9(1&2):1-15.
Hedley JD, Roelfsema CM, Chollett I, Harborne AR, Heron SF, Weeks SJ, … Mumby, PJ (2016b, February 6). Remote sensing of coral reefs for monitoring and management: A review. Remote Sensing, Vol. 8, 118 p. https://doi.org10.3390/ rs8020118
Hughes TP, Baird AH, Bellwood DR, Card M, Connolly SR, Folke C, Grosberg R, Hoegh-Guldberg O, Jackson JB, Kleypas J, Lough JM 2003 Climate change, Human Impacts, and the Resilience of Coral Reefs. Science 301(5635):929-933.
Huliselan NV 1983 Penyebaran telur dan larva di Perairan Maluku, suatu studi awal di perairan Teluk Ambon. Laporan penelitian Fakultas Perikanan UNPATTI (tidak diterbitkan). 50 hal.
Irawan A, Nganro NR 2016 Distribution of seagrasses in Inner Ambon Bay. Jurnal Ilmu Dan Teknologi Kelautan Tropis, 8(1), 99-114. https://doi.org/10.29244/ jitkt.v8i1.12499 (in Indonesian with English Abstract).
Irawan A 2011 Komunitas lamun di Teluk Ambon. Perair. Maluku dan Sekitarnya 8, 61–69.
Irawan A, Prayudha B 2020 Changes in Ambon Bay Seagrass for the Past Five Years (2011–2016). IOP Conf. Ser. Earth Environ. Sci. 618, 012025. https://doi.org/10.1088/ 1755-1315/618/1/012025
Irawan A, Wawo M, Tupan CI 2023 Seagrass vegetations in Ambon Bay and their current status. in Chapter 10. 13 p.
Kawakami Z 1974 Survey for bait and Skipjack fishing. Report to the government of Indonesia. FAO of the United Nations, Rome. 38 p.
Kenchington RA, Hudson BET 1988 Coral reef management handbook, UNESCO Jakarta (Indonesia). Regional Office for Science and Technology for South East Asia
Kesaulya HM, Poli H, Takumansang ED 2016 Landslide disaster mitigation planning in Ambon City. Spasial Perencanaan Wilayah dan Kota, 3(3):228-235. (in Indonesian with English abstract).
Kuo J 2007 New monocious seagrass of Halophila sulawesii (Hydrocharitaceae) from Indonesia. Aquatic Botany 87:171-175.
Kuriandewa TE 1998 Lamun di Teluk Ambon dan permasalahannya. Dalam: LF Wenno dan F. Salampessy (eds.). Prosiding Seminar Pengenalan Pesisir Pulau Ambon. Pemda Maluku, BPPD Maluku dan Balitbang SDL P3O LIPI. Ambon. Hlm.: 29-39.
Leatemia FW 1996 Status Terumbu Karang Teluk Ambon. Makalah dipersentasikan pada Seminar danLokakarya Pengelolaan Teluk Ambon tanggal 25-27 Juni 1996. Balitbang Sumberdaya Laut,Puslitbang Oseanologi – LIPI, BAPPEDA Tkt. I Provinsi Maluku dan Universitas Pattimura Ambon (tidak diterbitkan).
Leatemia FW and Alik R 2008 Kondisi terumbu karang Teluk Ambon. Laporan Penelitian Tahun Anggaran 2008.
Matakupan MS 1983 Suatu pembahasan tentang ikan umpan dan daerah penangkapannya di Teluk Ambon Pada musim timur. Skripsi Fakultas Peternakan/ Perikanan Universitas Pattimura Afiliasi Fakultas Perinana Institut Pertanian Bogor. 73
hal. Moluccas in figures, 1983. Statistic Office of Molucca Province, 579 p.
Moluccas in figures. 1996. Statistic Office of Molucca Province, 753p.
Nardin W, Vona L, Fagherazzi S 2021 Sediment deposition affects mangrove forests in the Mekong Delta, Vietnam. Continental Shelf Research 213. https:// doi.org10.1016/j.csr. 2020. 10431. Nontji A 1996 Status kondisi hidrologi, sedimentasi dan biologi Teluk Ambon saat ini. Prosiding Seminar dan Lokakarya Pengelolaan Teluk Ambon, 1-6.
Ongkers OTS 2006 Pemantauan terhadap parameter populasi ina teri merah (Encrasicholina heteroloba) di Teluk Ambon bagian dalam. Prosiding Seminar Nasional Ikan IV, Jatiluhur, 29-30 Agustus 2006. 31-40. Paler MKO, DominicTabañag IDF, Siacor FDC, Geraldino PJL, Waltonc MEM, Dunn C, Skovc MW, Hiddink JG, Taboadab EB 2022 Elucidating the surface macroplastic load, types and distribution in mangrove areas around Cebu Island, Philippines and its policy implications. Science of The Total Environment. Vol. 838, Part 3, https://doi.org/10.1016/j.scitotenv.2022.156408.
Pelasula DD, Alik R, Ruli F, Hukom FD, Pay L and Hehuat J 2021 A coral reef health study and its problem in Leti, Moa and Wetar Island, Mollucas Province. IOP Conference Series: Earth and Environ. Sci. 777(1):012003. https://doi.org/10.1088/ 1755-1315/777/1/012003
Pelasula DD 2008 The impact of land Change on Ambon Bay coastal ecosystems. Master thesis Pattimura University, Ambon, 96 p. (in Indonesian With English Abstract).
Pendleton L, Comte A, Langdon C, Ekstrom JA, Cooley SR, Suatoni L, Beck MW, Brander LM, Burke L, Cinner JE, Doherty C 2016 Coral reefs and people in a high-CO2 world: where can science make a difference to people? PloS one 11(11): e0164699 Pramudji, 1987. Condition of mangrove forest in Ambon Bay Coastal Area. Teluk Ambon: Biologi, Perikanan, Oseanografi dan Geologi, 34-40.
Balai Penelitian dan Pengembangan Sumberdaya Laut, Pusat Penelitian dan Pengemba-ngan Oseanologi, Lembaga Ilmu Pengetahuan Indonesia. (in Indonesian with English abstract).
Puturuhu F, Kastanya A, Osok RM, Salman R 2020. Regional Action Plan for Climate Change Mitigation and Adaptation Towards Climate Smart Cities – Case Study in Ambon City. In (Latumahina, F.S., B. Latuamury, and M. Tjoa, 2020 (editors). Prosiding Seminar Nasional Perhutanan Sosial, dan Masa Depan Pengelolaan Hutan, 317-331, Ambon 25–26 November 2019. Universitas Pattimura Press. (in Indonesian with English abstract).
Ramos-Scharrón CE, Torres-Pulliza D, Hernández-Delgado EA 2015 Watershed- and island wide-scale land cover changes in Puerto Rico (1930s-2004) and their potential effects on coral reef ecosystems. Science of the Total Environment, 506–507:(241–251). https://doi.org/10.1016/.scitotenv.2014.11.016. Rugebregt MJ, Matuanakotta, C, Syafrizal 2020 Keanekaragaman jenis, Tutupan Lamun dan Kualitas Air di Teluk Ambon. Jurnal Ilmu Lingkungan, 18(3), 589-594, doi:10.14710/jil.18.3.589-594 Rumpeniak YR, Hiariej A, Sahertian DE 2020 Inventarisasi jenis-jenis lamun (seagrass) dan asosiasinya dengan gastropoda diperairan pantai Desa Poka Kecamatan Teluk Ambon, Kota Ambon Provinsi Maluku. Rumphius Pattimura Biol. J. 2, 16–23. Sapulete D 1983 Ciri-ciri pemijahan (spawning ground) dan asuhan (nursery ground) ikan Puri (Stolephorus spp) di Teluk Ambon. Lonawarta No.1, Thn IV:9. Sapulete D 2007 in Sapulete D, Mudjiono and Pelasula D (Editor). Konservasi Biota Laut Ambon-Lembaga Ilmu Pengetahuan Indonesia.
Sathyendranath S, Morel A, 1983 Light emerging from the sea: Interpretation and uses in remote sensing in Cracknell A.P. (ed) Marine Science and Technology, Reidel Publishing Company, pp.323-357.
SihaIoho D 1996. Pengelolaan kawasan pesisir dan dampak lingkungannya. Prosiding Seminar dan Lokakarya Pengelolaan Teluk Ambon, 10-20.
Sinay LJ, Lembang FK, Aulele SN, Mustamu D 2020 Analysis of monthly rainfall in Ambon City using the heteroscedasticity model: Sarima-Garch. MEDIA STATISTIKA 13(1):68-79. http://ejournal.undip.ac.id/index.php/media_statistika (in Indonesian with English Abstract).
Suharsono, 2017 (Editor). Status terumbu karang Indonesia. Puslit Oseanografi–LIPI. 30 hal. Sumadhiharga OK 1978 Beberapa aspek biologi ikan puri (teri) Stelophorus heterolobus (RUPPELL) di Teluk Ambon. Oseanologi di Indonesia, 9:29-41. Susetiono 2007. Seagrass and Fauna in Kuta Bay, Lombok Island. P2O-LIPI Jakarta 155 hal. (in Indonesian).
Sutarna IN 1987 Keanekaragaman dan Kekayaan Jenis Karang Batu (Stony Coral) di Teluk Ambon Bagian Luar, Pulau Ambon.” Teluk Ambon I: Biologi, Perikanan, Oseanografi, dan Geologi, diedit oleh S. Soemodihardjo, dkk. Ambon: Balai Penelitan dan Pengembangan Sumberdaya Laut, 1 – 9. Sutomo 1983 Zooplankton di sekitar daerah mangrove Teluk Ambon bagian dalam. Makalah diajukan pada Kongres Nasional Biologi ke VI di Surabaya, 17-29. Suyadi 2009. The Condition of Mangrove Forest in Ambon Bay: Prospect and Challenges. Berita Biologi 9(5):481-490. (in Indonesian with English abstract). Suyadi 2012 A Decade of Mangrove Forest Condition in Ambon Bay, Maluku. Jurnal Biologi Indonesia 8(1): 197-203 (2012). (in Indonesian with English abstract).
Suyadi Manullang CY 2020 Distribution of plastic debris pollution and it is implications on mangrove vegetation. Marine Pollution Bulletin, Vol.160, Nov. 2020, 111642. https://doi.org/10.1016/j.marpolbul.2020.111642.
Suyadi, Prayudha B, Renyaan J, Indrabudi T, Manulang CY and Naroli I 2021 Mangrove in the Urban Area of Small Islands: Vegetation Health, Potential, and Management Challenges. IOP Conf. Series: Earth and Environmental Science 789 (2021) 012012. doi:10.1088/ 1755-1315/789/1/012012.
Suyadi, Rahmila YI, Naroly I. 2022 Dynamics of mangrove ecosystem, ecosystem services, pressures, and management strategies. Chapter 12 in this book. 14 p. Topliss BJ, Almoss Sl and Hill PP 1990 Algorithms for remote sensing of high concentrations in organic sediment. Int. J. Remote Sensing. 11(06):947-966.
Tuhumury SF 2008 The Community Status of Seagrass In Coastal Water of Inner Ambon Bay (IAB). Ichthyos, 7(2):85-88. (in Indonesian with English Abstract).
Tupan CI, Pentury R and Uneputty PA 2016 Population dynamics of seagrass Thalassia hemprichii in Tanjung Tiram waters, Poka, Ambon Island, Indonesia. AACL Bioflux, 9(6):1286-1293. http://www.bioflux.com.ro/aac.
van Bijsterveldt CEJ, van Wesenbeeck BK, Ramadhani S, Raven OV, van Gool FE, Pribadi R, Bouma TJ 2021 Does plastic waste kill mangroves? A field experiment to assess the impact of macro plastics on mangrove growth, stress response, and survival. Science of the Total Environment 756 (2021) 143826. https://doi. org/10.1016/ j.scitotenv.2020.143826.
Wouthuyzen S, Suartana A, Sumadhiharga OK 1984. Studi tentang dinamika ikan Puri Merah, Stolephhorus heterolobus (RUPPEL) dan kaitannya dengan Perikanan umpan di Teluk Ambon Bagian dalam. Oseanologi di Indonesia 1984, No.18:1-20. Wouthuyzen S 2001 Sifat optik Teluk Ambon dan kaitannya dengan Masalah lingkungan. Oseanologi dan Limnologi di Indonesia, 2001 33(15-26).
All references has check carefully and fixed
